

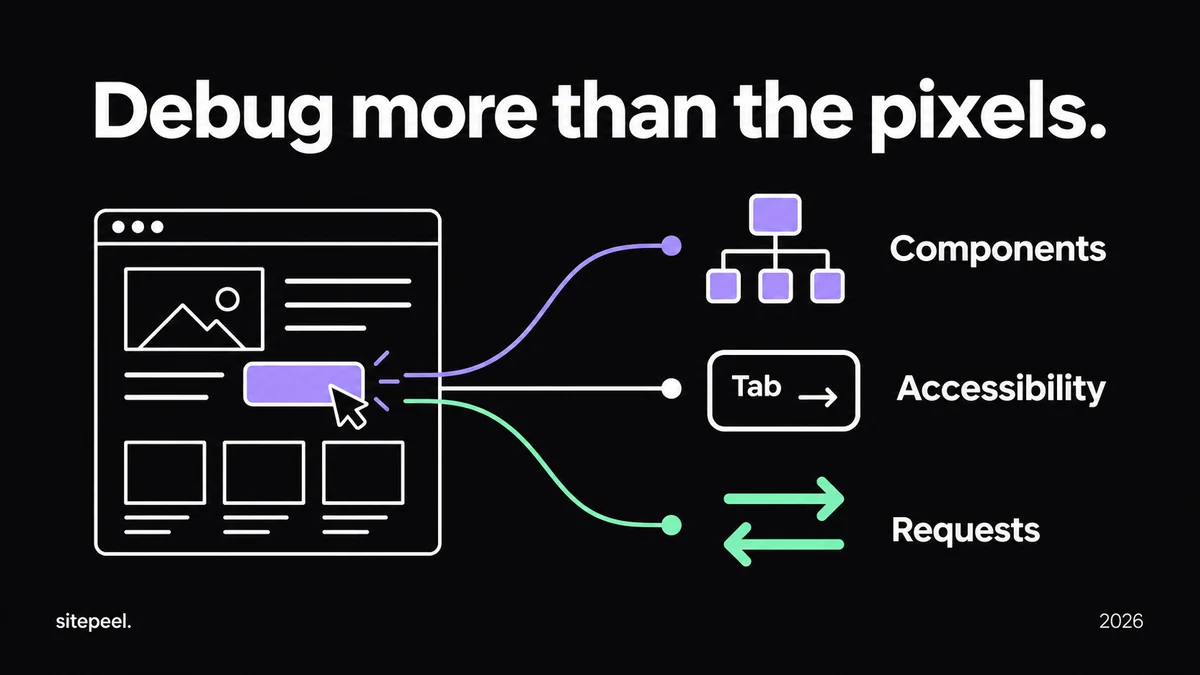
Start with the problem, then choose the extension
We make Sitepeel. This is an editorial comparison based on official documentation and listings checked on September 20, 2026, not a speed benchmark or a claim that one tool wins every task. Check the publisher’s current plan and permissions before installing.
This developer shortlist focuses on investigating behavior and handing fixes back to the source project. For a visual inspiration toolkit, use the separate designer comparison.
| Extension | Useful for | Boundary |
|---|---|---|
| React Developer Tools | Inspecting React components, props and state | Framework-specific; it is not a universal DOM debugger |
| axe DevTools | Finding accessibility issues in a page state | Automated findings do not replace manual testing |
| Web Developer | A toolbar of website inspection utilities | Use alongside the browser’s debugging panels |
| Wappalyzer | Researching technologies used by a website | Detection is not proof of every backend dependency |
| Sitepeel | Collecting rendered code and design references | An export is not the original component source |
React Developer Tools for component questions
Use React Developer Tools when the question involves a React component’s props, state or rendering behavior. Its Components and Profiler panels complement the browser’s Elements view. Choose the view that matches the level of the bug.
For example, a menu that renders the wrong label may involve application state. A correct label that is clipped by its container is more likely a layout question. Inspect the responsible layer before changing both the component and the CSS at once.
Record the reproduction steps and the state that triggers the problem. A screenshot of the final screen is useful evidence, but it cannot show the entire sequence that produced it.
axe DevTools for an accessibility review
axe DevTools is designed for accessibility testing. Run a check on the state people actually use: a menu open, a dialog visible or a form displaying an error. Review the identified element and the explanation before changing its markup.
Follow the automated pass with keyboard navigation and a review of labels and focus behavior. A clean automated scan does not establish that the complete journey works for every user. Save the issue, the fix and the state you retested.
Keep the initial review small enough to act on. One accurately reproduced form issue is more useful than an untriaged export of warnings from several unrelated screens.
Web Developer and Wappalyzer for investigation
Chris Pederick’s Web Developer extension collects website utilities in a toolbar. It is worth evaluating when you repeatedly reach for page inspection helpers. Check the official publisher rather than installing a similarly named listing.
Wappalyzer answers a different question: which technologies can it detect on this site? Use those results to guide investigation, then confirm important assumptions in the project configuration or with its maintainers.
Neither result should be treated as a complete source-code audit. A public page can expose a frontend library without revealing how authentication, storage or deployment are implemented.
Sitepeel for the design-to-code handoff
Sitepeel is useful when a bug report or design request needs a concrete visual reference. Pick an element to collect its rendered HTML and CSS, or create Design MD to record the observed styling. Attach the source URL and viewport so the next person can compare the same state.
Move the final change into your actual components and stylesheets. An exported DOM can contain wrappers, generated class names and state-specific markup that should be simplified before integration. Preserve semantic elements and real interaction behavior.
Keep a reproducible debugging setup
Save one reproduction before enabling several tools. If an issue appears only in your main browser profile, retest in a clean profile and reintroduce relevant extensions one at a time. That separates the site’s behavior from changes introduced by your environment.
Use the same viewport, account state and page data for before-and-after checks. Change one cause at a time, rerun the failing action and record the outcome. For a rendering problem, check more than a single convenient desktop width.
# Browser debugging record

URL / route:
Browser and version:
Viewport and zoom:
Required account or test data:

## Reproduce
1. [starting state]
2. [action]
3. [actual result]
Expected result:

## Investigate
- Layer: [component / CSS / network / accessibility]
- Tool and observation:
- Clean-profile result:

## Fix and verify
- Source change:
- Original failure retested:
- Narrow viewport checked:
- Keyboard path checked:
- Remaining uncertainty: